Webhook Logs and Troubleshooting

Logs

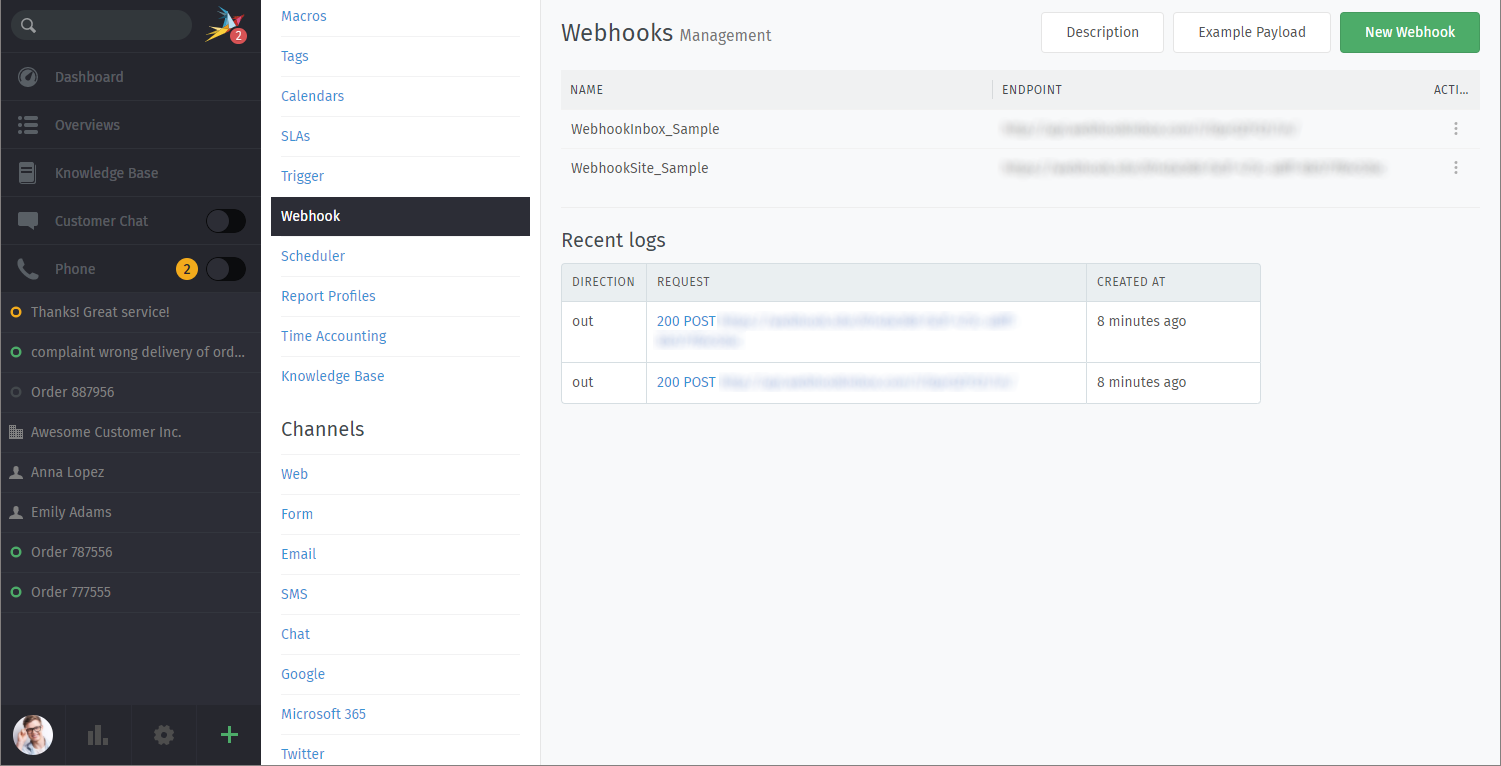
Zammad provides a history of your recent webhook events, helping you monitor and debug interactions with third-party services. You can access them under Recent Logs in the webhook settings.

Each log entry contains details about the webhook request and response, allowing you to troubleshoot issues. Clicking on a request link opens a detailed modal with the following information:

  • Direction: Always out, indicating outgoing requests from Zammad.

  • URL: The destination URL where Zammad sent the request.

  • Method: Always POST.

  • Status: The HTTP status code received from the remote server. A successful request returns a 2xx code.

  • Request: Displays the HTTP request headers and payload that Zammad sent.

  • Response: Shows the response headers from the remote server.

  • Created at: The timestamp when Zammad sent the request.

Debugging Webhook Issues

If a webhook fails (e.g. receiving a 4xx or 5xx status code), check the request and response details to diagnose the issue. Common causes include incorrect URLs, authentication errors, or server-side failures.

Before deploying webhooks in production, you can use testing tools to inspect and debug requests. If you do so, make sure to exclude any sensitive or personal data.

The following tools/services might be helpful:

  • Beeceptor: A free tool to capture and inspect webhook requests in real time. Set up a temporary endpoint to verify the payload structure and headers.

  • Webhook.site: Another useful alternative for real-time request logging and debugging.