Report Profiles
In the following section you can find instructions about how to create and change report profiles. These report profiles define which kind of tickets should be included in a report. You can find an explanation about how to use the reporting in the reporting section of the user documentation. The reporting is useful to view statistics, get an overview of the number of tickets (e.g. of a specific customer) and to download ticket data from Zammad.
You can find the configuration in Zammad’s admin settings under
Manage > Report Profiles. To create and edit report profiles,
admin.report_profile permission is required. To access the reporting itself,
report permission is required.
Warning
Be aware that granting users the report permission may
leak information. Consider to limit the available profiles to specific
roles, instead of just granting or not granting access to all profiles.
Creating specific Roles for this purpose may be
helpful.
Create and Edit Profiles
To create a new reporting profile, click the New Profile button. To edit
an existing profile, simply click on the row. You can Clone or Delete
a profile by choosing the corresponding action from the ⠇ menu in the action
column.
Configuration
To configure a report profile, you need to provide some information:
- Name
Name of the reporting profile. This name is also shown in the reporting itself where your users can choose between the profiles.
- Filter
Define which tickets you want to include in a report. You can filter the tickets as in other places in Zammad by using conditions which your tickets must match.
Hint
👋 Looking for more depth explanation on conditions? 🤓
Many condition settings in Zammad, no matter if in ticket scope or not, re-appear in several places of Zammad. For this reason we created a dedicated documentation section to avoid duplicate content.
Have a look at Object Conditions to learn even more! 🎉
- Preview
This section gives you a preview of tickets which match your configured filter.
- Available for the following roles
Define if the reporting profile is limited to one or more specific roles (click on it to move it to the left side for limitation). If no role is specified (i.e. on the left side), all users with
reportingpermission can see the profile and its tickets.- Active
Set the profile to active or inactive.
Example
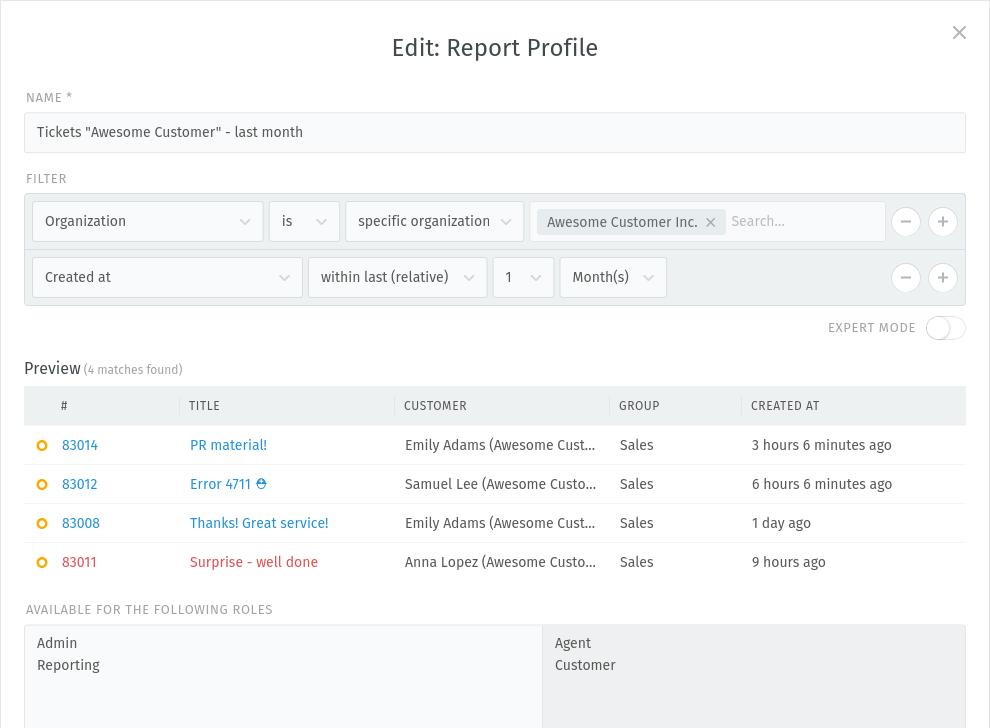
This example shows the statistics of all tickets of the organization “Awesome Customer Inc.” that were created during the last month. This profile is limited to the roles “Admin” and “Reporting”.
Use the Reporting
You can find the reporting section in the bottom left corner in Zammad next to the avatar icon or your initials. If you can’t see the reporting button, check the permissions.

Also have a look at the reporting section of the user documentation for more information about the usage.
External Reporting Tools
If the integrated reporting is not enough for you, you can even use third party tools like Grafana! Please have a look at Reporting Tools in the system documentation, where you can find more information.